
A statistical technique for determining if categorical variables have a significant relationship is the chi-square test. When attempting to determine if the observed frequency distribution of categorical data deviates from the anticipated frequency distribution, it is beneficial.
Working of Chi-Square Tests
Formulate Hypotheses
Establishing the alternative hypothesis (H1) and the null hypothesis (H0) is the first stage. The alternative hypothesis contends a significant difference, while the null hypothesis normally holds no significant difference between the observed and anticipated frequencies.
Expected Frequencies Calculation
Determine the predicted frequencies for each category based on the sample data, assuming that the variables are independent.
Test Statistic Calculation
By utilising the formula to compare the observed frequencies with the anticipated frequencies, the chi-square test statistic is determined, the formula:
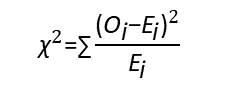
- Oi is the observed frequency of category i
- Ei is the expected frequency of category i
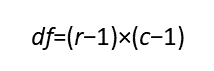
Degrees of freedom
In a chi-square test, the number of categories minus one is the equivalent of the degrees of freedom (df).

Critical value comparison
You can use statistical software or a chi-square distribution table to determine the crucial value at a certain significance level using the computed chi-square statistic and degrees of freedom.
Decision making
You reject the null hypothesis and come to the conclusion that there is a significant correlation between the variables if the computed chi-square statistic is higher than the critical value. You are unable to reject the null hypothesis if it is not bigger.
Formulas
Degrees of independence (Df)
The number of categories or levels in the variables being tested determines the degree of freedom in a chi-square test. With r rows and c columns in a contingency table, the degrees of freedom formula:
Chi-Square Test Statistic
By utilising the formula to compare the observed frequencies with the anticipated frequencies, the chi-square test statistic is determined, the formula:
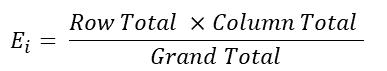
Expected frequencies (Ei)
The formula is used to get the predicted frequency for every cell in a contingency table:
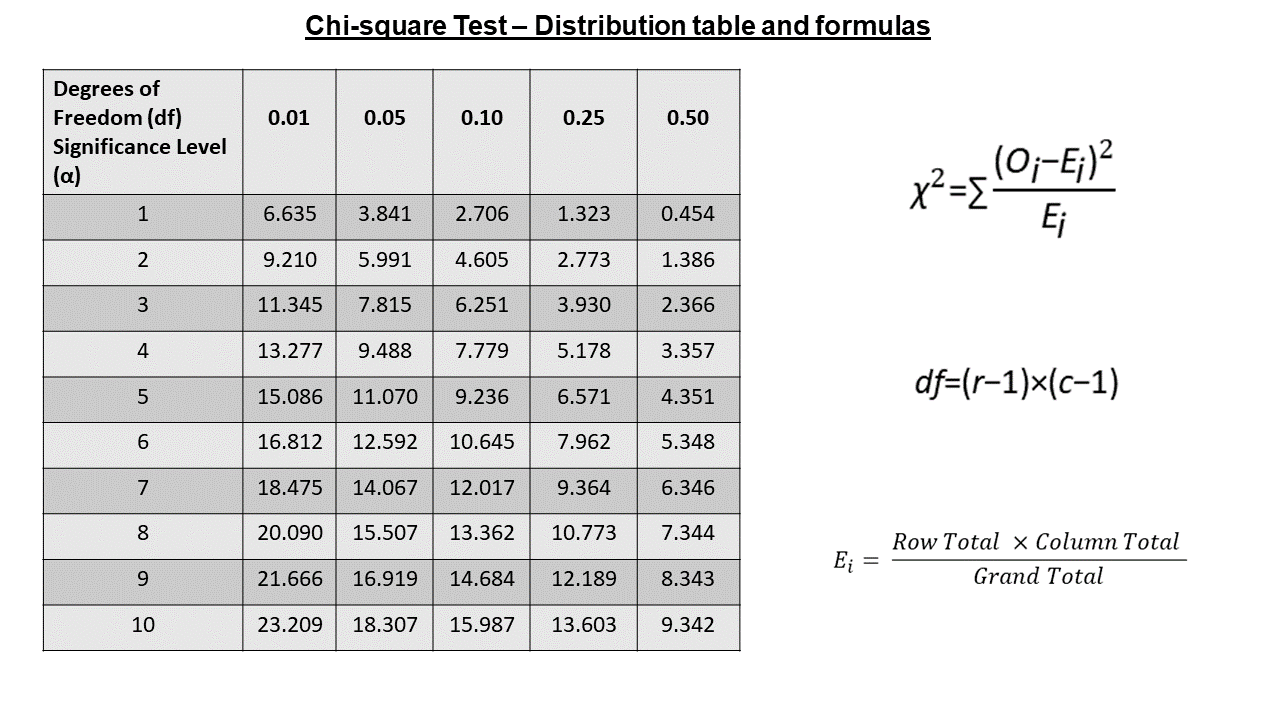
Chi-square test distribution table
Critical values are provided for various degrees of freedom and significance levels in a chi-square distribution table. When using chi-square tests for hypothesis testing, the crucial values are utilised to ascertain whether the computed chi-square statistic is greater than the significance threshold.
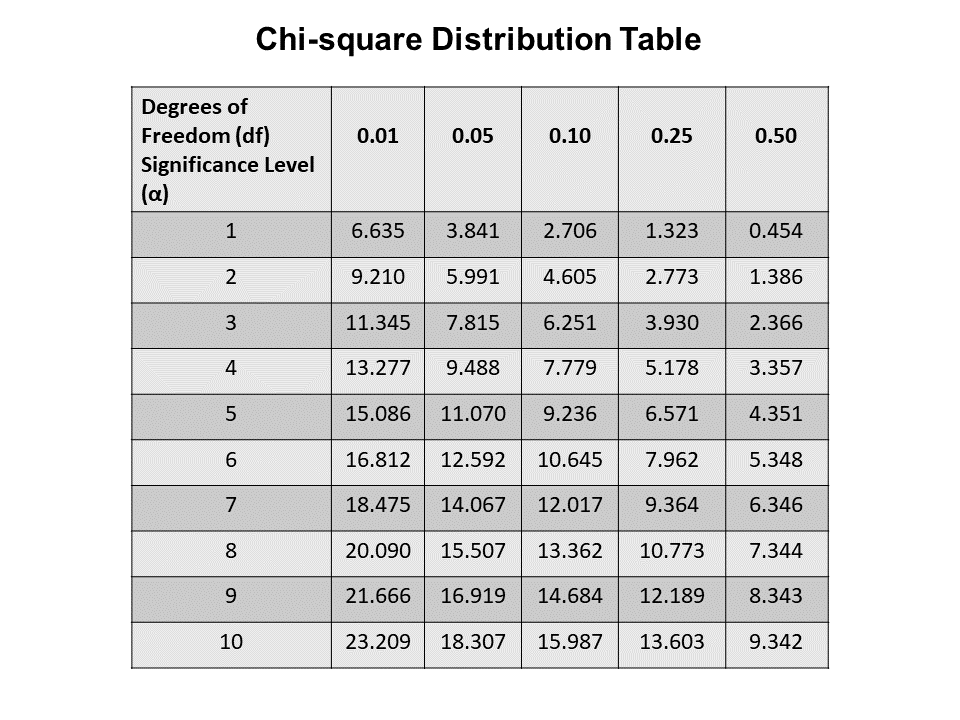
- The rows represent different degrees of freedom (df), which are determined by the number of categories minus 1 in the chi-square test.
- The columns represent different significance levels (α).
- The values in the table are the critical values of the chi-square statistic corresponding to the specific combination of degrees of freedom and significance level.
Applications of Chi-square test
- Biology and Genetics: The chi-square test is a tool used in genetics to examine the outcomes of genetic crossings and assess if the observed ratios of genotypes or phenotypes differ significantly from the ratios predicted by Mendelian genetics. It is also used to check for departures from Hardy-Weinberg equilibrium in population genetics.
- Ecology/Environmental Sciences: Chi-square tests are used in ecology and environmental studies to examine ecological data, including species abundance, preferred habitats, and the dispersion of organisms under various environmental circumstances.
- Quality Control: In quality control, the chi-square test is used to determine if observed defect frequencies in manufactured goods substantially differ from predicted defect rates. It assists in determining if modifications are required to uphold quality requirements and whether the manufacturing process is consistent.
Also Read| Mitosis: Definition, Stages, Mechanism of Cell Division, and Diagrams
Last Update